MotionH

MotionH is a fitness application with advanced features aimed at preventing injuries and aiding in recovery. The beta version is currently in production. The app will be integrated with a website that allows for mentoring from a trainer, physiotherapist, or doctor.

Tools - Figma
Brief

I joined the project when work on it was already underway. Assumptions had been implemented, quantitative research conducted, and competitor benchmarking carried out. My initial tasks included solving several issues complicating the user flow, simplifying the application, designing new features, streamlining existing ones, working on the benchmark, and improving personas. In this case study, I present a few of the many simplifications we implemented.

The goal creator - guide

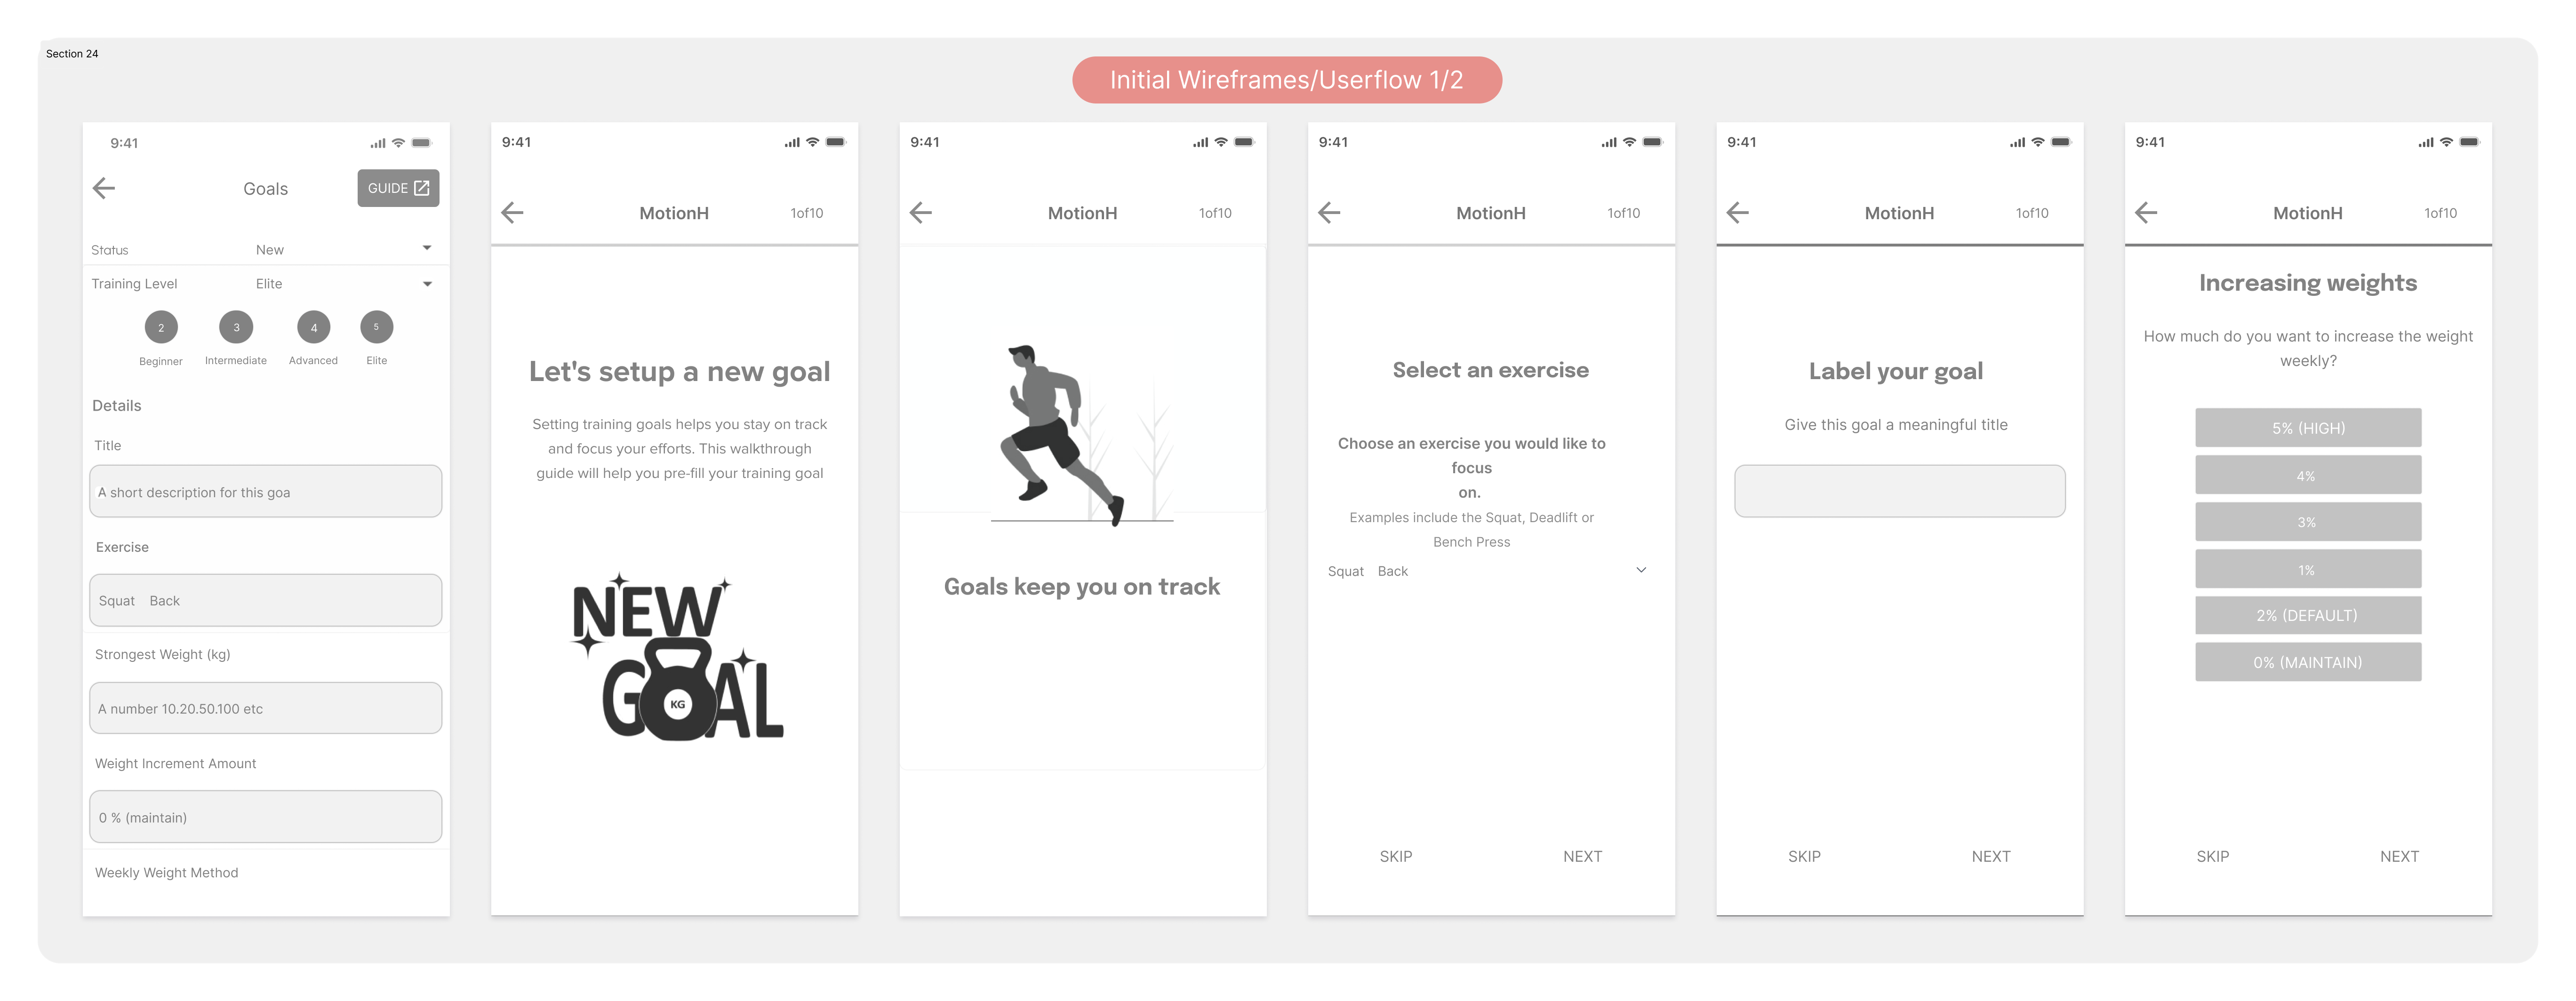
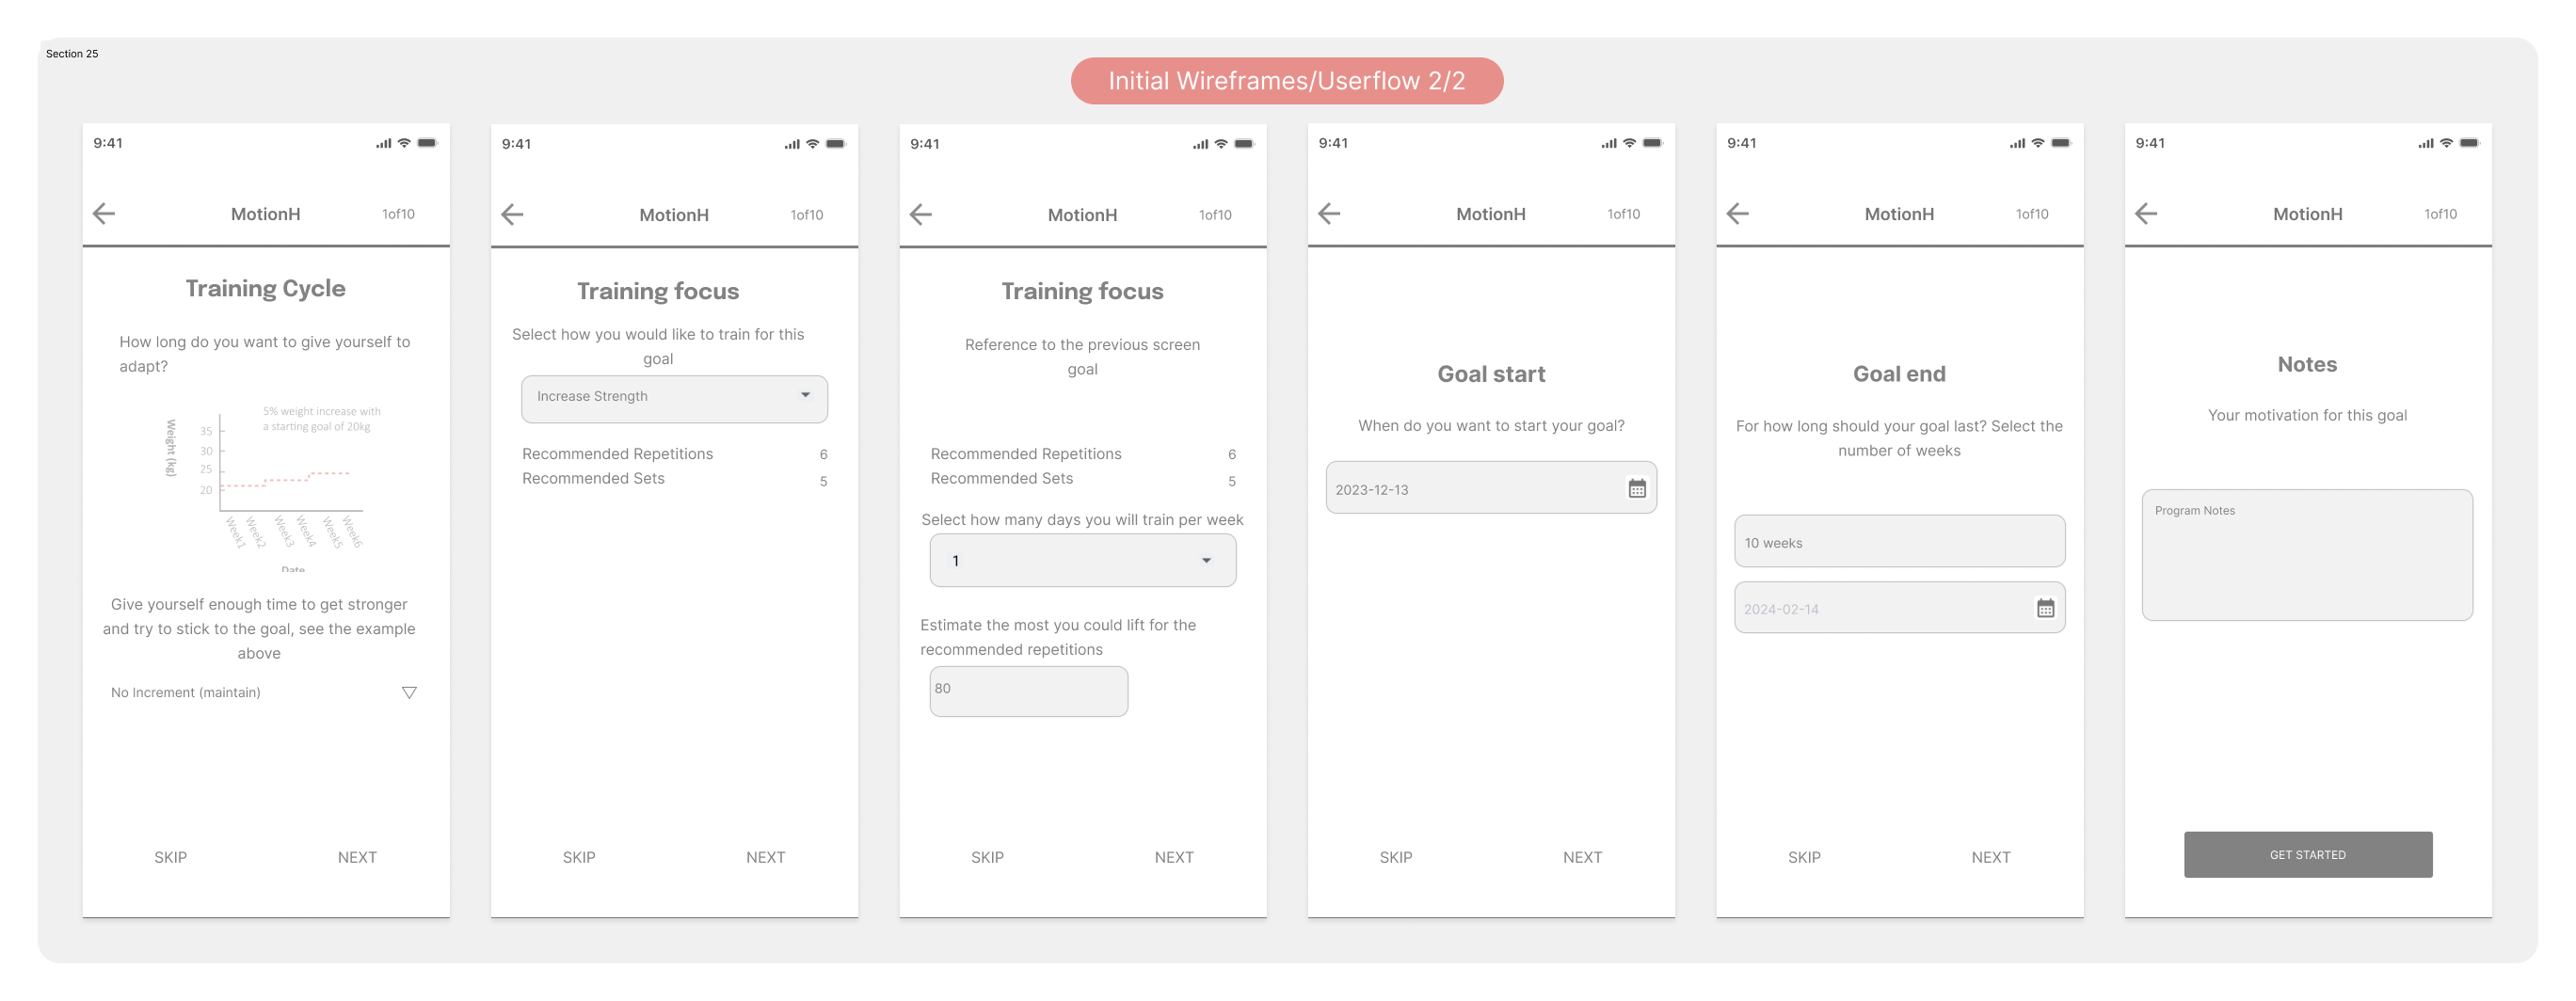
One of the app's functionalities is the creation of a training goal that the user wants to achieve through regular exercise. The initial version of the goal-setting process consisted of 14 screens and had numerous errors, which I aimed to eliminate while shortening and simplifying the overall process. The ability to create "training goals" is available in two ways - either by filling out a form (described below in point 2) or through a guide that leads the user step by step, screen by screen. The initial wireframes had too many steps, data entry was quite monotonous, and the order of the steps was not intuitive.

I was asked to simplify the guide process to make it more intuitive, readable, and shorter.

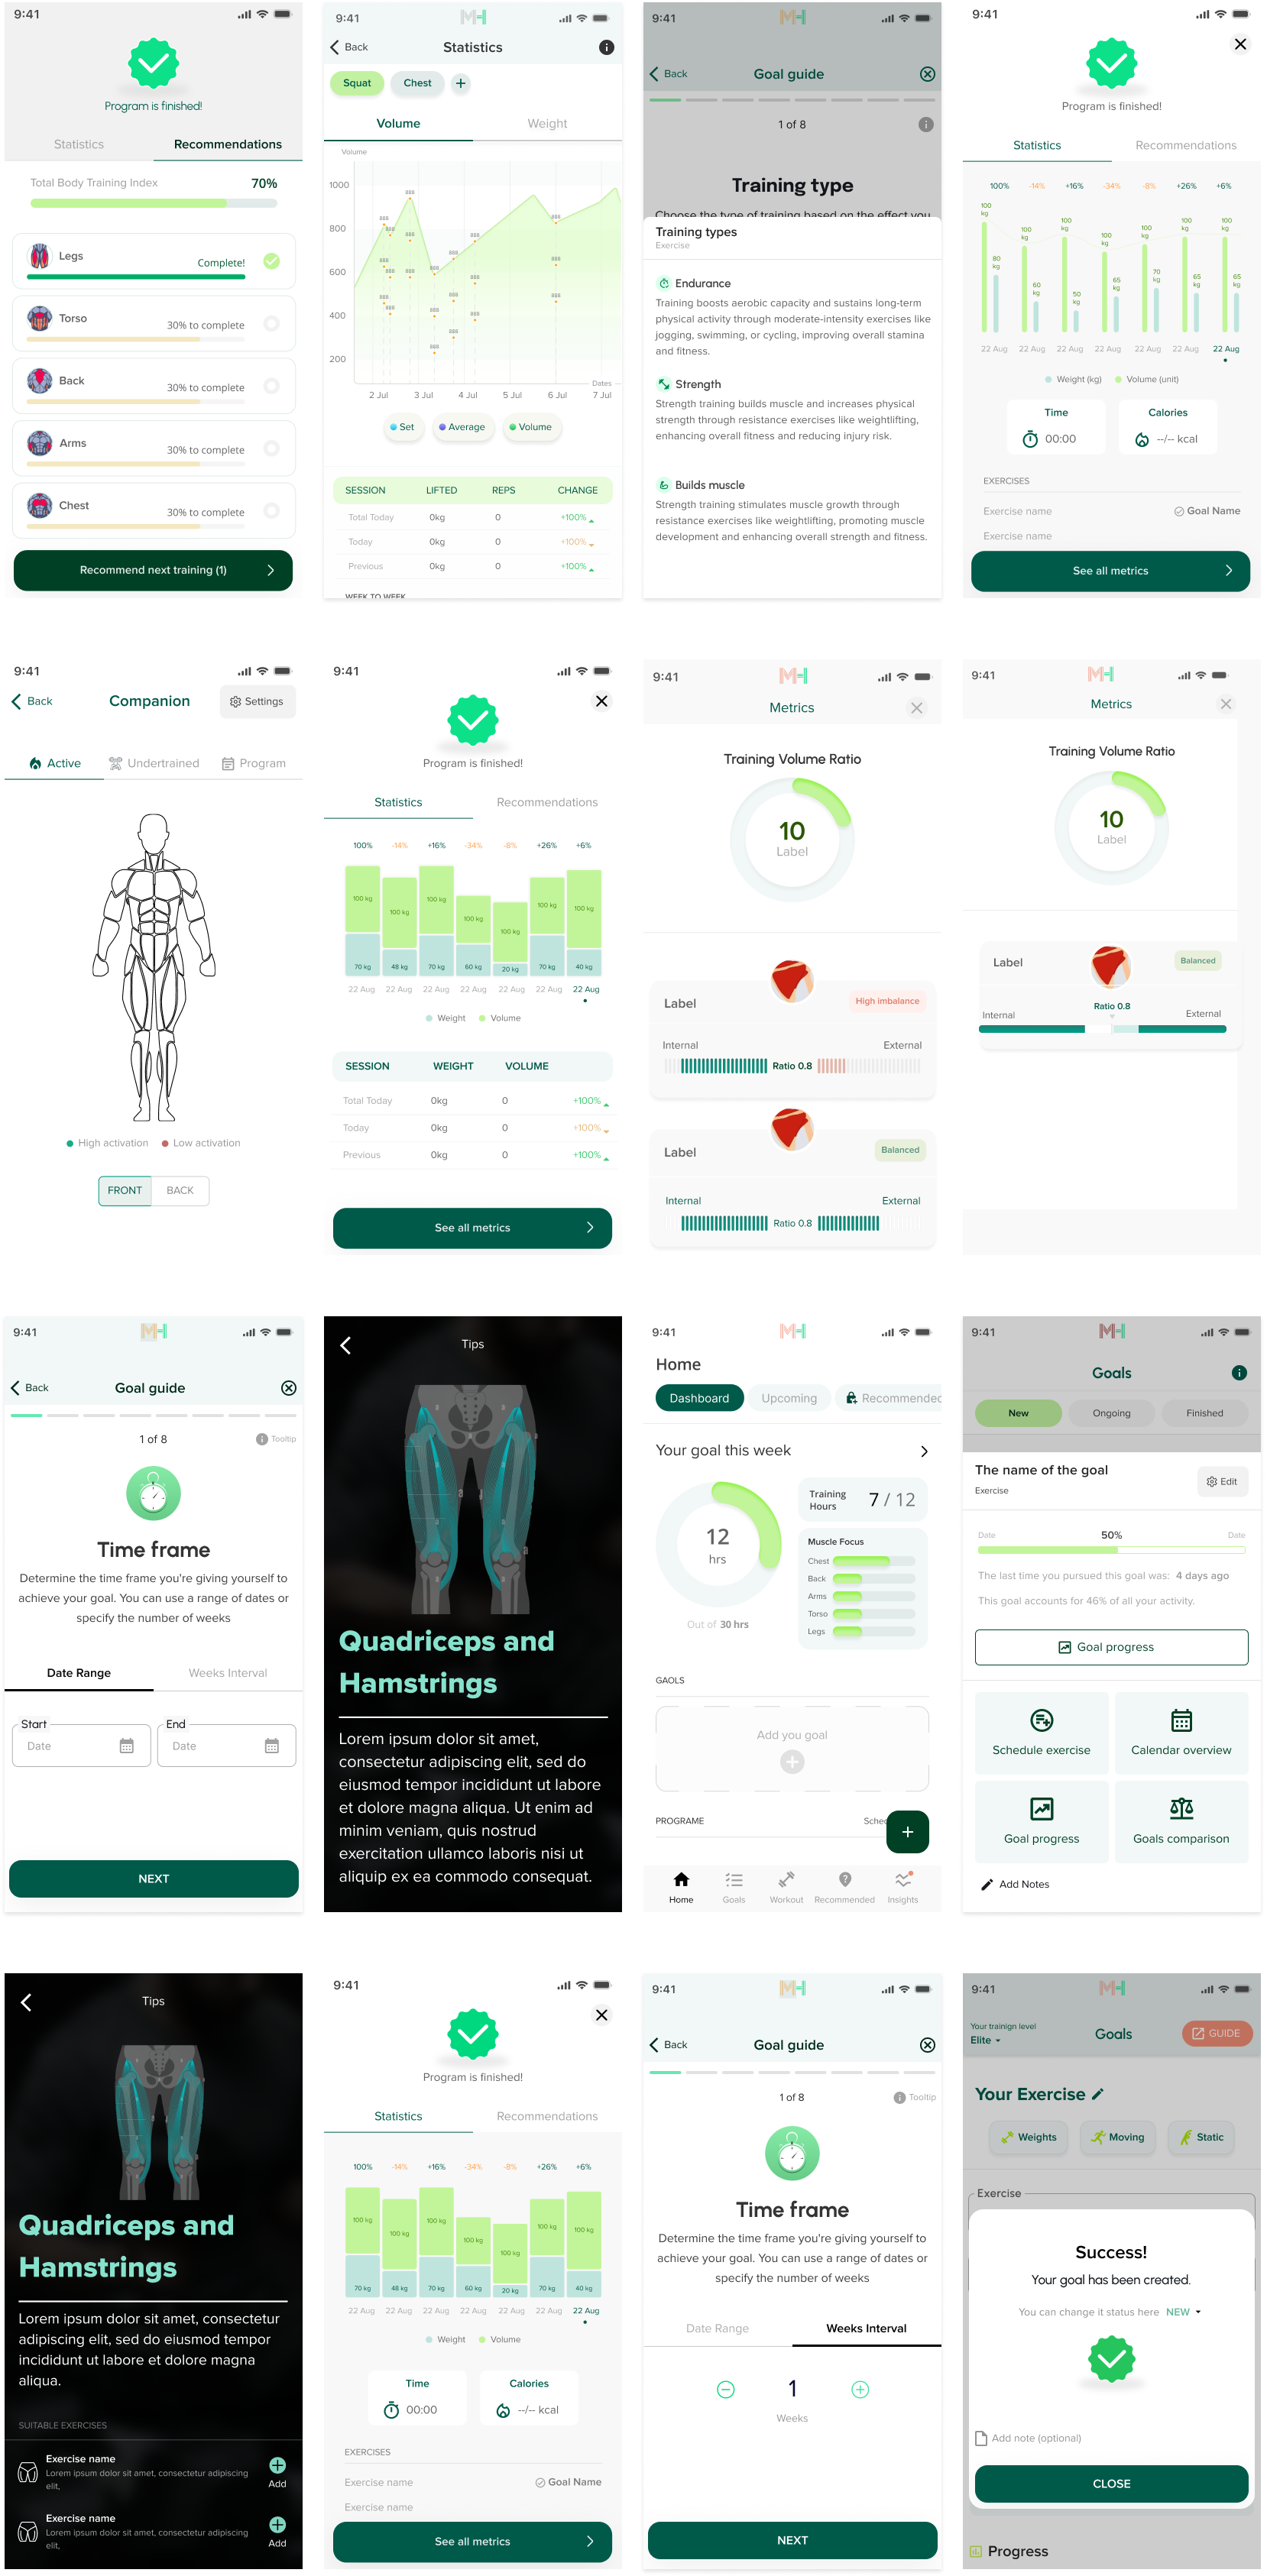
Zdjęcie 1 Zdjęcie 2
Image 1 Image 2 Image 3 Image 4 Image 5 Image 6 Image 7 Image 8 Image 9

Changes I made

  • I changed the order of the steps according to logic - type of exercise, goal, time frame.
  • I added a division of exercise types according to logic - weight exercises, movement, and static. I also added icons.
  • I added an indicator showing the number of steps and how many steps are left. I also added an information option for each step in the form of a "tooltip."
  • I combined the screens where the user enters the start and end time frames into one screen.
  • A problematic issue was giving the user the option to define time frames either in weeks or by entering dates. To address this, I combined both options and used radio buttons.
  • I consolidated the screens where the user inputs numerical data (weekly sessions, sets, reps) into one screen, replacing dropdown fields with plus and minus buttons for better visualization.
  • I removed the "skip" button because all data is necessary to define the goal. I introduced a global process reset button.
  • I moved the option to enter the goal name to the very beginning. Asking the user to enter the name at the start didn't make sense, as they might not know what goal they want to set yet.
  • I introduced icons where needed, varied button sizes to differentiate screens (especially when similar ones follow one another), and visually improved the information architecture on each screen.

The goal creator - formular

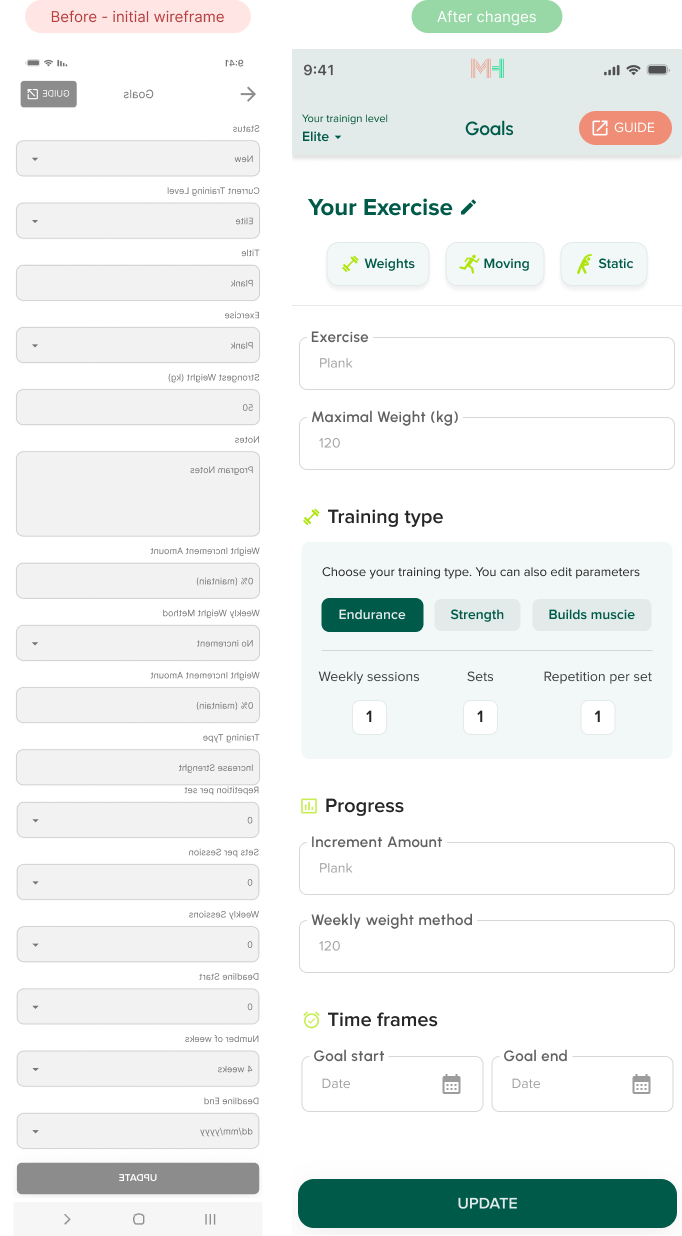
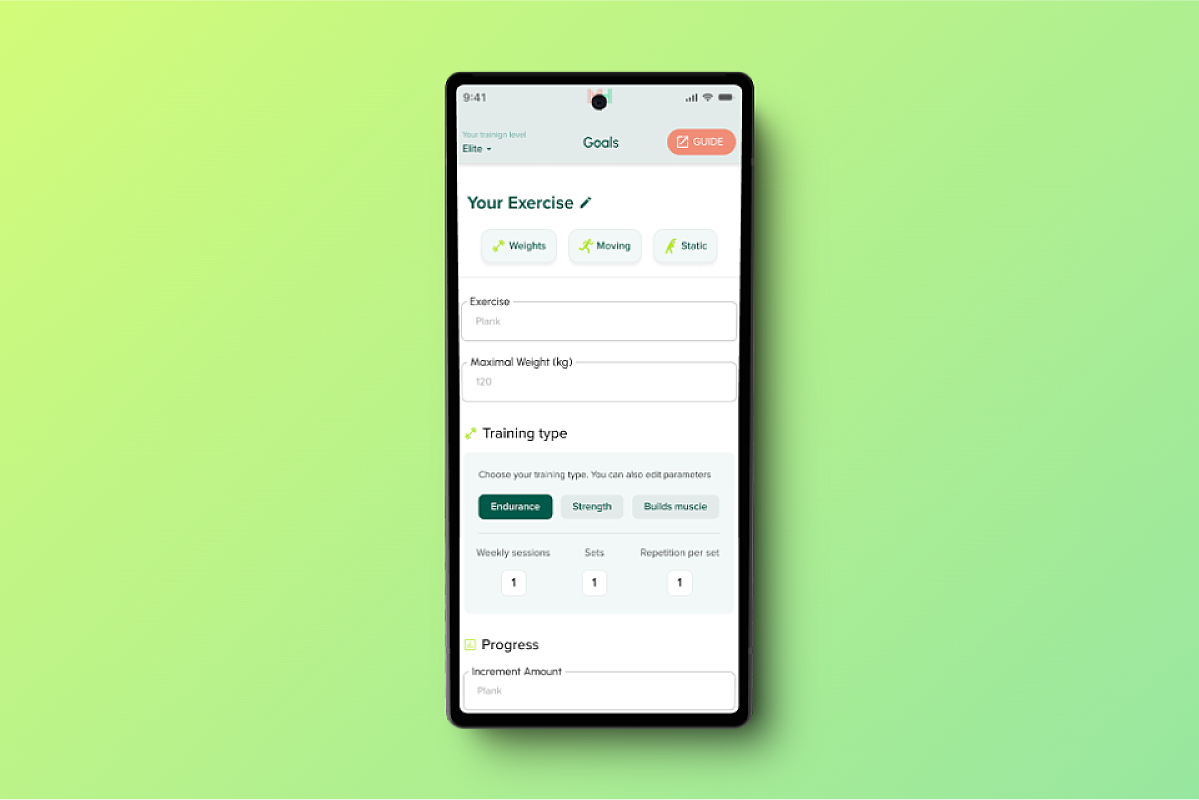
The second option for setting training goals is a form on a single screen. The issue I needed to address was simplifying it, changing its monotonous appearance, and adding variety. A major issue with this screen was the presence of 16 inputs. It’s unreasonable to expect users to be so determined that they fill out each field individually, especially since they are driven only by their own motivation. The process needed to be significantly shortened, which I achieved—I reduced the screen by half while retaining the ability to enter all the original data.

Zdjęcie

Changes I made

  • I divided the data entry into four logical sections. Breaking it down into smaller elements prevents users from feeling discouraged, compared to seeing a single block of inputs.
  • I changed the inputs so that the labels overlap their top border. This reduced the required space and made the inputs more readable.
  • I rearranged the inputs to follow a more logical order—from broader selections to narrower ones, starting with the training goal and ending with the time frame. The option to add optional notes has been moved to the screen that confirms goal creation.
  • I diversified the data entry methods. Where possible, I replaced dropdowns with buttons or pickers.
  • For numerical data (repetitions, sets, etc.), I consolidated it into a single field and provided a more user-friendly picker instead of input fields.
  • I shortened the time frame input fields (start, end) and grouped them in a single row. The input fields are sized to suggest the length of the data they contain.
  • Global information (such as skill level, e.g., elite) is defined during the app onboarding. While it can be changed later, these are pre-entered data. Therefore, I moved this option from an input field, as it was before, to the top navigation bar.
  • I diversified the data entry methods, shortened the form, and made it more streamlined and user-friendly.

The Metrics Screens

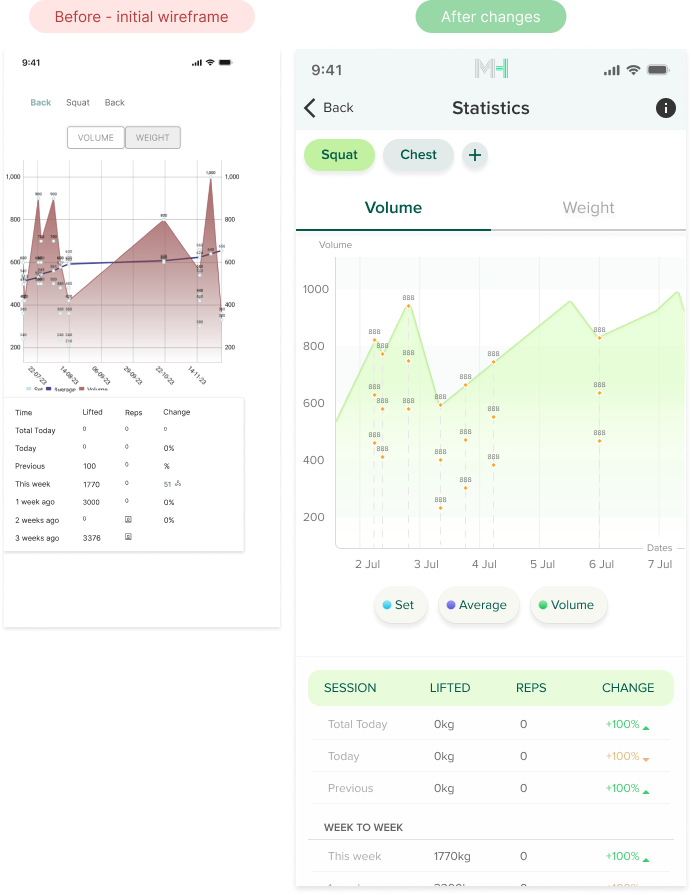
The charts are designed to display various metrics—progress over time, progress towards a selected goal, volume of weights lifted, their weight, etc. The suggested screen was not very readable and somewhat unclear. My task was to simplify it by redesigning it and adding features to improve its readability.

Zdjęcie

Changes I made

  • I removed the data from both sides of the chart and left it only on the left side.
  • To improve readability, I introduced the option to select what appears on the chart using buttons below it.
  • I connected logically related data points on the chart (e.g., weights lifted in a given session) with a dotted line to make it clear that they are associated.
  • To enhance the clarity and visibility of the data below the chart, I divided the information into logical groups (which previously appeared all together) and visually highlighted their hierarchy.
  • To make the chart immediately readable, I introduced labels for the x and y axes. Previously, their function was only understandable from context.
  • I added buttons at the top with pre-set training goals, allowing the user to switch metrics for different goals on a single screen. Previously, to view these metrics, the user had to access each goal individually.

The goal's list screen

The process was significantly simplified to 9 screens while retaining all the necessary steps and data inputs. I also changed the order of the steps in the goal-setting process to make it more logical and intuitive.

Zdjęcie

Changes I made

  • To avoid ambiguity, I changed the names of the buttons at the top. The previous labels, "current" and "ongoing," had too similar meanings.
  • I removed the option to access individual features through icons on the cards. Instead, I made the entire card clickable—tapping on it brings up a bottom sheet with available options. Selecting one of the options opens the corresponding window.
  • I introduced a percentage value for the suggested metric to show the status of the goal.
  • To enhance readability, I expanded the categorization of goals, which was previously based solely on color (in the top-right corner of the card), by adding a label indicating the category to which each goal belongs.
  • I changed the icons in the bottom navigation to ensure they are unambiguous for users and avoid any ambiguity or contradiction with their labels.

The main issue was accessing options for each card. In the originally designed screen, each card was to have icons for access. However, due to usability concerns (many icons next to each other, potential for confusion) and aesthetic reasons (repetition of the same icons across multiple cards), I decided to use a bottom sheet. This solution improved visibility, enhanced usability by breaking down data into smaller portions, and addressed aesthetic concerns.


Other Screens

😎 Merci ... for now. This is ongoing project, so will be updated very soon.

See other projects